
AI Applications

Classification Algorithms

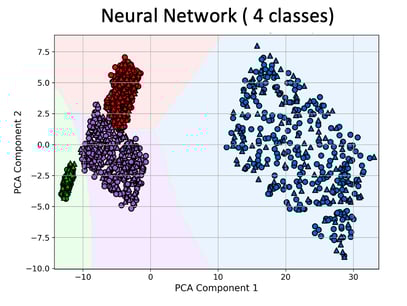
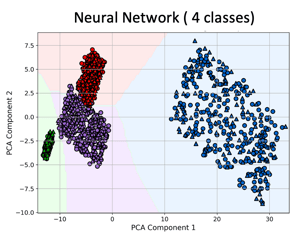
Neural network classifier leverages multiple non-linear transformations to approximate complex decision surfaces. Its boundaries are smooth and adaptive, allowing it to capture intricate, non-linear relationships within the data. This flexibility often results in tighter class separation and better generalization in heterogeneous feature spaces.
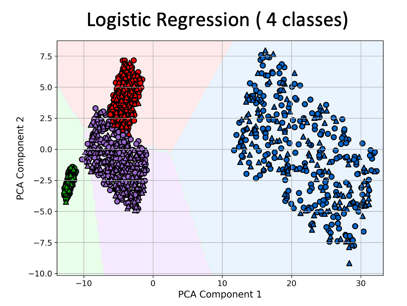
Logistic regression produces linear decision surfaces by modeling the probability of class membership as a function of weighted input features. The resulting boundaries are flat and globally consistent, making the model robust for linearly separable data but limited in capturing non-linear interactions or curved class distributions.
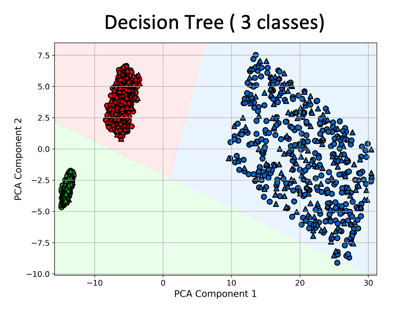
Decision tree model segments the feature space using recursive, axis-aligned splits. This results in discrete, rectangular classification regions, reflecting the tree’s hierarchical structure. While effective for capturing simple rules, the model’s boundaries are often coarse and may overfit or underfit in complex domains.
Animal Classification (based on physical traits)
Classification algorithms are learning methods that assign labels to input data based on learned patterns. Some common learning models—decision tree, logistic regression, and neural network— for classification based on traits and features. Each model reveals a distinct decision-making pattern: from rigid, rule-based partitions to linear separations and flexible non-linear boundaries. The resulting visualizations highlight how model complexity shapes classification behavior in feature space. Often very useful in biology for group clustering based on gene expression
Relationship Algorithms
A relationship algorithms identify patterns or associations between variables, items, or entities within a dataset. Common in fields like gene network in biology, market basket analysis and recommendation systems, these algorithms uncover how one element relates to others—such as co-occurring items, user preferences, or link structures—often without requiring labeled outcomes.
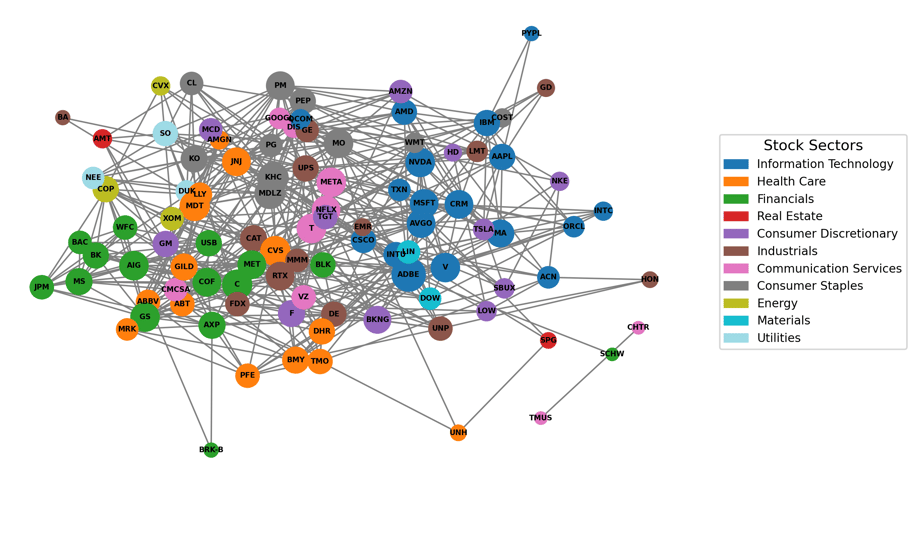
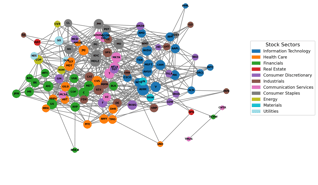

The relationships among major stocks based on their fundamental financial metrics such as P/E ratio, EPS, dividend yield, and market cap. Each node represents a company, colored by its stock sector. Edges connect companies with similar financial profiles, using a similarity threshold (e.g., cosine or Euclidean distance). Stocks that cluster closely together share valuation characteristics. The layout uses a force-directed algorithm to group similar companies while separating dissimilar ones. This provides an intuitive map of the market based on underlying financial fundamentals.
Stock Market Relationship
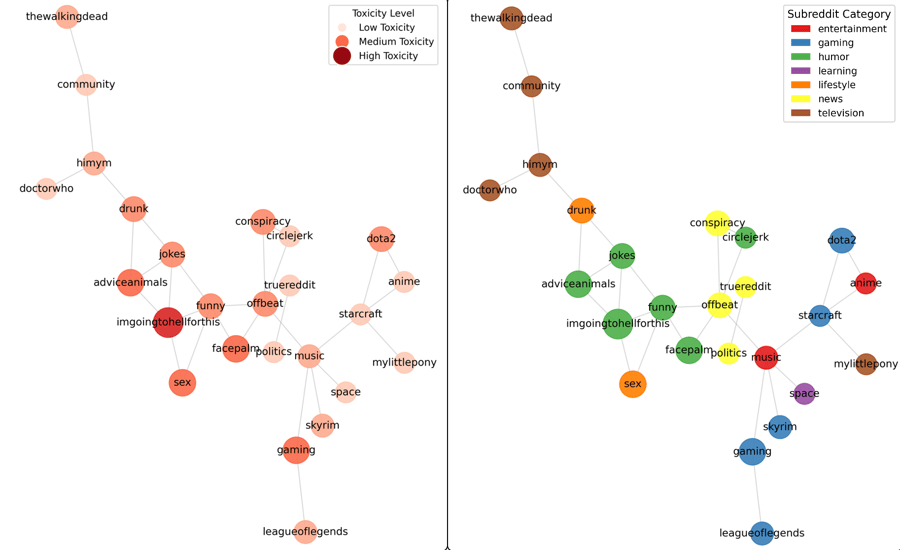
Graph Neural Network (GNN) to analyze the semantic and social relationships between Reddit subreddits using their comment content. Each subreddit was represented as a node, with node features derived from sentence embeddings (via a transformer model) of subreddit discussions. Edges between subreddits were constructed based on cosine similarity of their textual embeddings, reflecting thematic closeness. Toxicity scores was computed for each subreddit using Google’s Perspective API and trained the GNN to understand how toxicity patterns relate across connected communities. Visualization highlighted both category (color) and toxicity (node size), offering insight into how subreddit themes and tone propagate across the Reddit network
Toxic Contents in Reddit Communities
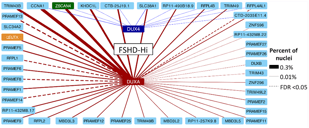
This Network Graph illustrates a gene coexpression network centered on the FSHD-Hi transcriptional program, with DUXA and DUX4 as key regulatory hubs. Each node represents a gene, and edges denote coexpression relationships inferred from single-nucleus RNA-seq data. This relationship algorithm captures how transcription factors like DUXA orchestrate downstream gene activation in Facioscapulohumeral Muscular Dystrophy (FSHD). This approach exemplifies how relationship graphs can be used to decode disease-associated regulatory programs from single-cell data.